
Hit Rate Analysis
Analysing the Data: Methodology 1
This analysis applies to warrantless Victoria Police searches that are recorded on L19C field contact forms.
One way that racial profiling by police can be identified is through examining the reasonableness of police searches. Under legislation — other than in designated areas or where there is a Firearms Protection Order in place (both excluded from this analysis) — police are not authorised to search a person unless they hold a suspicion, based on reasonable grounds, that a person is in possession of a contraband item. When police perform a ‘reasonable grounds’ search we can infer (it is only an inference) that it is more likely the police had reasonable grounds for suspicion if they ‘find’ a contraband item following the search. This inference is not reasonable in individual cases and there are many examples of police finding a contraband item following an unreasonable search. However, over a large number of searches, the find rate provides a widely accepted mechanism to assess the overall reasonableness of police searches.
In this section we examine the reasonableness of police searches in Victoria through analysing their find rate. The analysis is focussed on reasonable grounds searches under the following legislation:
Section 82, Section 82A, Drugs Poisons and Controlled Substances Act 1981 - search without warrant powers;
Section 10, 10AA Control of Weapons Act 1990 - search without warrant powers;
Section 13 Graffiti Prevention Act 2007 - search without warrant powers;
Section 149 Firearms Act 1996 - search without warrant powers;
1.1 What is Victoria Police’s search find rate over time for reasonable grounds searches?
Figure 1 below contains the total number of searches police in Victoria conduct per year (orange column), the hit rate of those searches (i.e. the number of finds) (yellow column) and the percentage of searches that resulted in a find (green line).

Figure 1 above shows that the number of searches Victoria Police performs annually increased by about 1,799 searches between 2018 to 2022. Between 2022 to 2024 it fell by over 5,000 searches. The data indicates that the total annual reasonable grounds hit rate has fluctuated from 16.4% to 19.7%. In other words, less than 1 in 5 reasonable grounds searches carried out by Victoria are resulting in a find. In contrast, while the numbers of reasonable grounds searches are gradually reducing and hit rates are improving, the number of Firearms Protection Order searches are steadily increasing and the hit rates of those searches are declining. In 2024, 8.4% of searches where a firearms protection order existed, resulted in a find (see Figure 2). Victorian Police hit rates for different types of legislation in 2024 are contained in Figure 9. For additional commentary on Figure 9 click here.
Click here to read a comparison of Victoria Police’s hit rate with other jurisdictions.
1.2 What is Victoria Police’s hit rate by racial appearance group over time?
To examine evidence for racial profiling using hit rates, we need to compare the find rates when police perform reasonable grounds searches for different racial appearance groups. Victoria Police records the ethnic appearance of the people that they search without warrant. Analysing police search decisions in response to police perception of a person’s racial background is a reasonable method for detecting bias in people whose ethnicity corresponds to appearance. However police perception data will not detect the racialised police-targeting of Aboriginal people recorded as being White. The results for Aboriginal people therefore must be read with caution. The way that Victoria Police categorises racialised groups creates further limitations in that process click here. Figure 3 below sets out the hit rates (find rates) of Victoria Police searches for groups of people perceived by police to be Aboriginal, African/Middle Eastern, Pacific Islander, Asian and Caucasian over time.
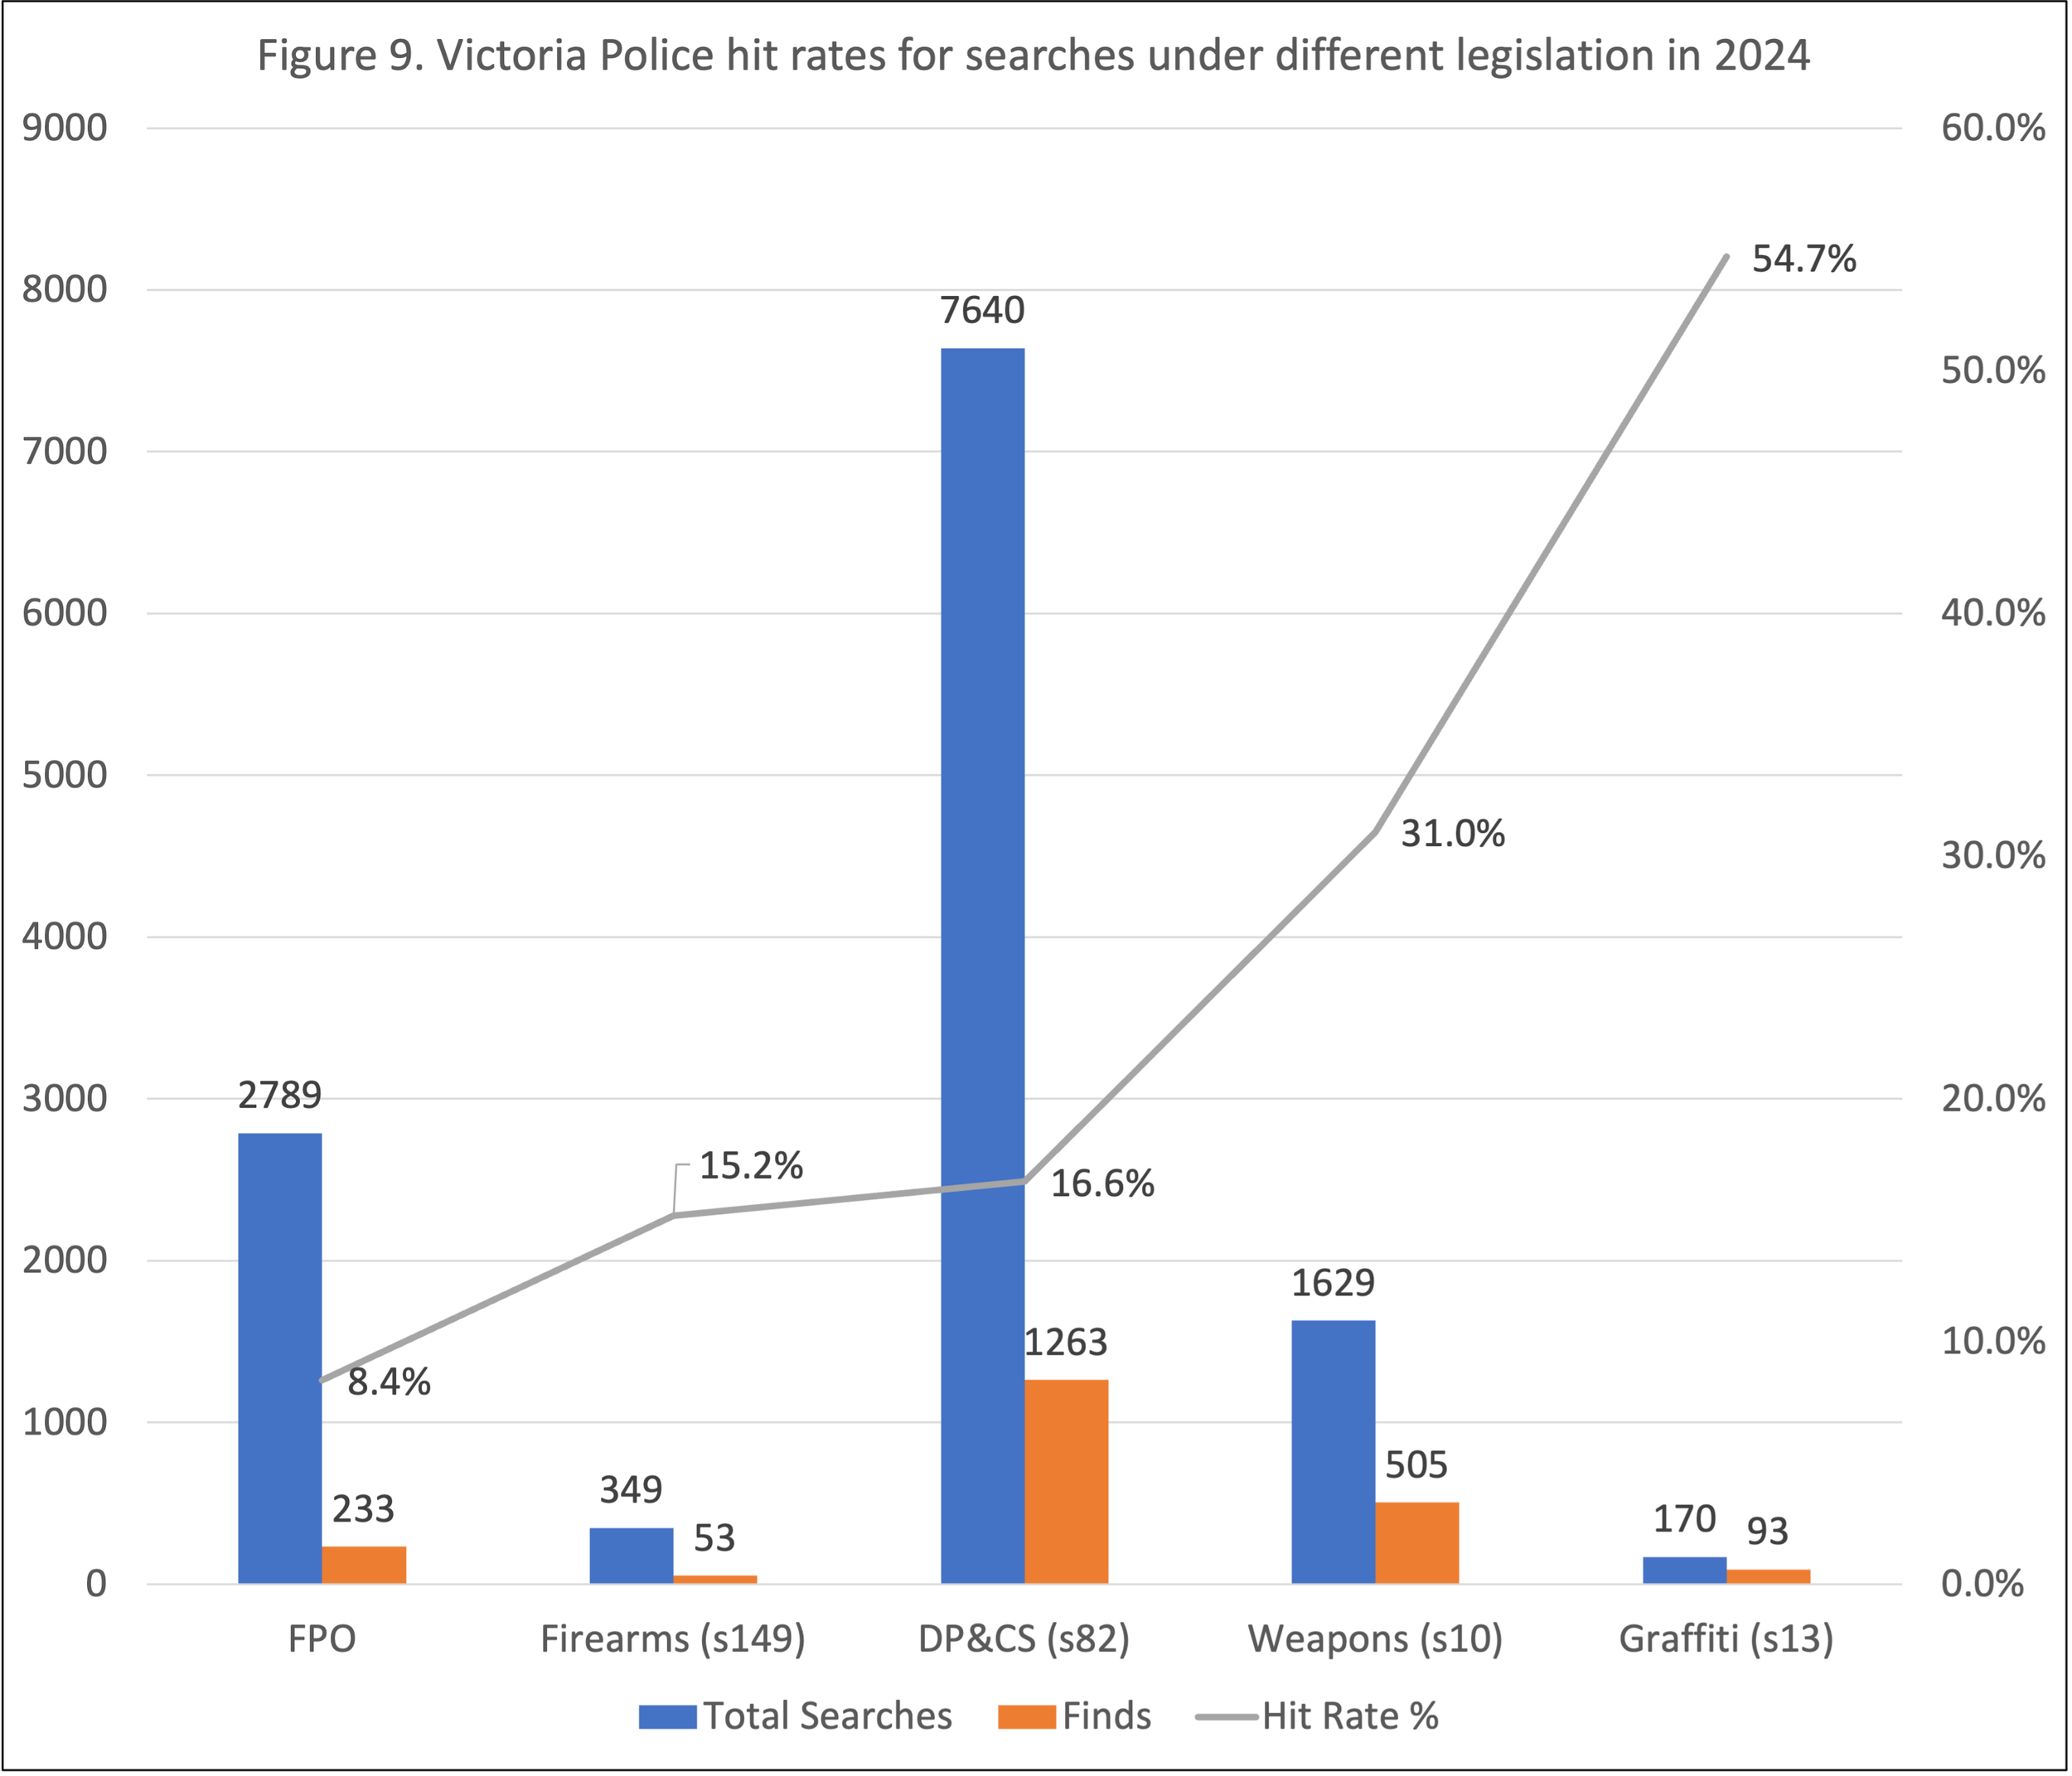
Figure 3 above reveals that when Victoria Police members search people of Middle Eastern/Mediterranean (light blue) African (red) Indian (darkest blue) and Asian (grey) appearance their ‘find rate’ is consistently lower than when police search people of Caucasian appearance (green). If the data provided by Victoria Police is an accurate reflection of Victoria Police practices, it provides evidence that over these periods the police were disproportionately using search powers without reasonable grounds, against each of these groups. This is evidence of racial profiling. The data indicates that while in 2018, the find rates for searches of people the police perceived to be Aboriginal was very low, (10.9%) since then, the find rate of police searches against people perceived by police to be Aboriginal has increased to 23.4%. [What is going on?] The data indicates that the raw find rate for Victoria Police searches of people they perceive to be Pacific Islander has been fluctuating over this period.
Figure 3 was created using the data from Table 1 below. Table 2 below is a table of the hit rate disproportionality ratios for different groups compared to people perceived to be Caucasian. It is calculated by dividing the hit rate (%) for each racial appearance group by the hit rate for people perceived to be Caucasian. Where the hit rate disproportionality ratio is 1, it means that the find rate of this group is equal to the find rate for people perceived to be Caucasian. Where the ratio is above 1, it means that the find rate is greater than for people perceived to be Caucasian. Where the ratio is below 1, it means the find rate is lower than for people perceived to be Caucasian. This ratio is useful for making comparisons.
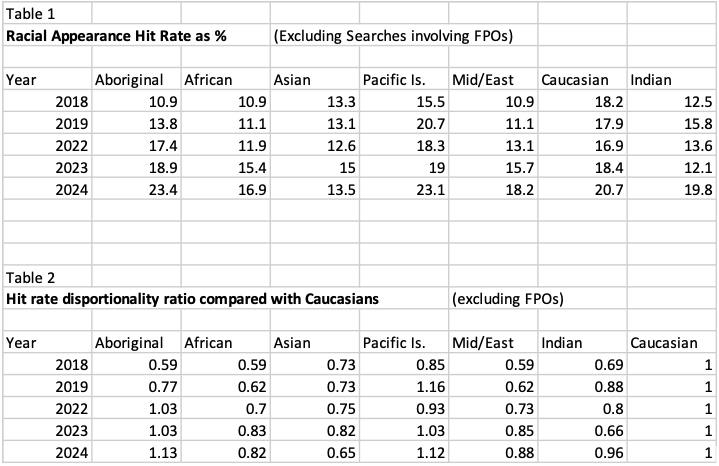
From 2022 onward Victoria Police separated people they perceived to be African from people they perceived to be Middle Eastern/Mediterranean in their data. We can observe that both groups continue to have amongst the lowest hit rates (experience the greatest amount of unjustified searches) of all the groups. In 2022 people perceived to be African had a lower hit rate than people perceived by police to be Middle Eastern. In 2024, people perceived by police to be Asian had the lowest hit rate.

Figure 10 visualises the hit rates (search find rates) of each ethnic appearance group using hit rate of Caucasian people as the benchmark (green). The hit rate of people perceived to be Caucasian is set at 1. This reveals that people perceived to be Asian, African, Middle-Eastern/Mediterranean and Indian are consistently less likely to have items found on them than people perceived by police to be Caucasian. This provides evidence for racial profiling against these groups.
1.3 What is Victoria Police’s hit rate for different operational groups?
Victoria Police have over 400 different operational groups that conduct searches without warrant across regional and metropolitan Victoria. These groups can be roughly classified into seven different types. The first group is the Uniform police who perform foot and divisional van patrols in local areas. Most local areas also have a Criminal Investigation Unit (‘CIU’). These are colloquially known as ‘detective’ or plain clothed police. There are also ‘DRU’ or Divisional Response Units. These units respond to crime reports across larger areas. Victoria Police also operate Highway Patrol police whose dominant task is traffic enforcement, and alcohol and drug testing. ‘Transit’ Police work across Victoria’s public transport network and PSOs (Protective Service Officers) operate with more limited police powers in designated areas. Finally there are individual crime units who perform a highly varied functions from family violence and sexual assault investigation to anti-gang and public order police functions. Figure 4 below describes the average number of total searches each operational type performed across 2018, 2019, 2022, 2023 and 2024.
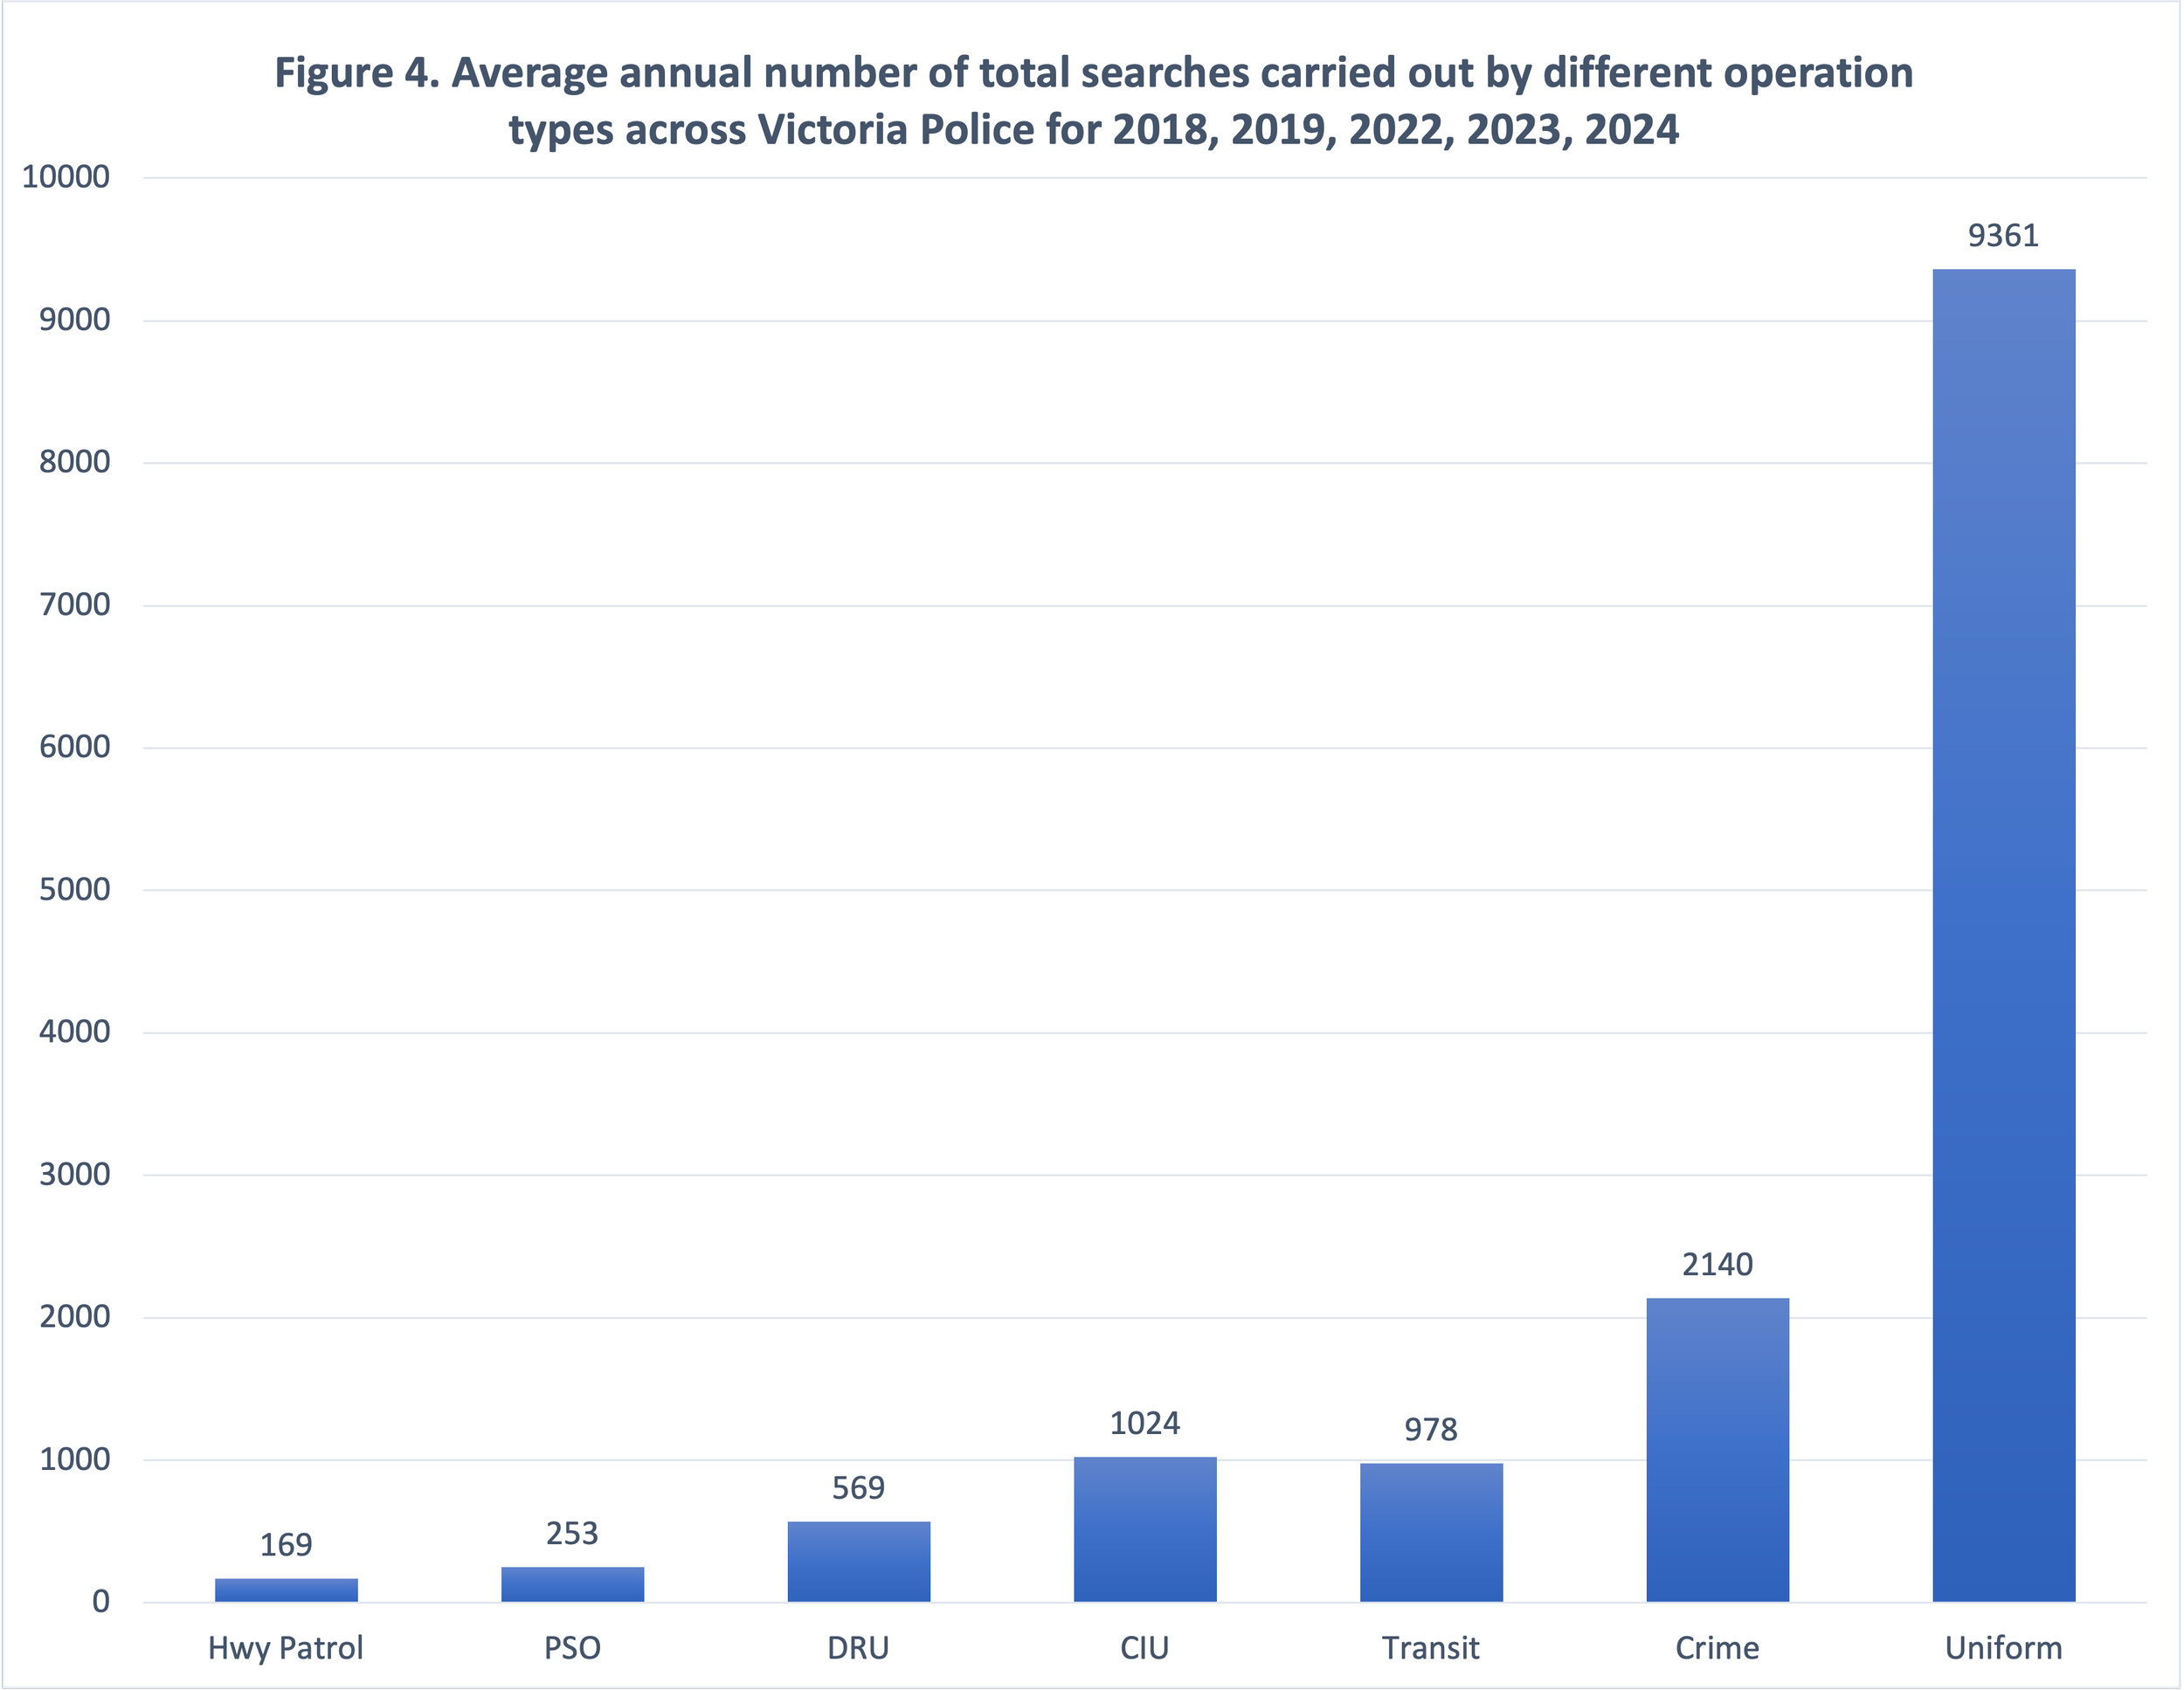
Figure 4 reveals that the Uniform police perform the vast majority of searches without warrant by police in Victoria. Highway Patrol perform the least number which is to be expected given that their dominant focus is on traffic law enforcement. Figure 5, below, sets out the find rates of each of the operational groupings for reasonable grounds searches.

Figure 5 indicates that the Highway Patrol, PSOs and Transit Police have the highest hit rate of the operational groups. Police records indicate that Transit Police have a hit rate above 30% while conducting a relatively large number of searches. Highway Patrol and PSOs conduct the lowest number of searches, so that small changes in the reasonableness of searches by these groups will have a noticeable effect. The lowest performing groups are the CIU, Crime, DRU and Uniform branches. In 2022 the DRU dropped to a search hit rate of 7.9%.
1.4 Tracking particular police units that disproportionately target racialised groups
We are monitoring a few operations over the years to track their performance. These figures include all recorded searches performed in 2023 and 2024. The cells in red are red flags, ie they are either disproportionately targeting a group (compared with the group’s population) and/or have a hit rate lower than 2024 caucasian baseline rate of 20.7% .
| 2023 | 2024 | |||
|---|---|---|---|---|
| Searches of people perceived to be Aboriginal | Percent of people perceived to be Aboriginal searched by operational group |
Hit rate of all searches by operational group |
Percent of people perceived to be Aboriginal searched by operational group |
Hit rate of all searches by operational group |
| Lakes Entrance Uniform |
16% (4/25) |
4% | 15% (3/20) |
20% |
| Red Cliffs Uniform |
7.9% (5/28) |
3.6% | No data |
No data |
| Echuca Uniform |
33.3% (6/18) |
11.1% | 14.3% (5/35) |
8.6% |
| Mildura Uniform |
19.4% (55/283) |
12% | 14.4% (35/243) |
25.9% |
| Searches of people perceived to be African | Percent of people perceived to be African searched by operational group |
Hit rate of all searches by operational group |
Percent of people perceived to be African searched by operational group |
Hit rate of all searches by operational group |
| DRU Caroline Springs, DIU Caroline Springs |
42.9% (9/21) |
9.5% | 57.1% (4/7) |
14.3% |
| NWM Crime Squad |
19.5% (8/41) |
9.8% | 5.2% (3/58) |
3.4% |
| CIU Casey |
33% (15/45) |
2% | ||
| Searches of people perceived to be Asian | Percent of people perceived to be Asian searched by operational group |
Hit rate of all searches by operational group |
Percent of people perceived to be Asian searched by operational group |
Hit rate of all searches by operational group |
| Major Drug Squad | 38.9% (7/18) | 16.7% | 0% (0/2) | 0% |
| Richmond Uniform Police | 25.9% (28/108) | 8.3% | 2.6% (1/38) | 13.2% |
| Searches of people perceived to be Middle-Eastern/ Mediterranean | Percent of people perceived to be Mid-East searched by operational group |
Hit rate of all searches by operational group |
Percent of people perceived to be Mid-East searched by operational group |
Hit rate of all searches by operational group |
| Anti-gang Taskforce | 75% (3/4) | 0% |
0% (0/11) | 0% |
| Broadmeadows Uniform |
41.6% (32/77) | 13% | 14.1% (11/78) | 25.6% |
| CIU Merri-bek | 50% (6/12) |
16.7% | 31.4% (11/35) | 5.7% |
| Searches of people perceived to be Pacific Islander |
Percent of people perceived to be Pac. Is. searched by operational group |
Hit rate of all searches by operational group |
Percent of people perceived to be Pac. Is. searched by operational group |
Hit rate of all searches by operational group |
| Major Drug Squad |
38.9% (7/18) | 16.7% | 0% (0/2) | 0% |
| Southern Metro Crime Squad | 50% (3/6) | 0% | 0% (0/4) | 25% |
| Eastern Region Crime Squad | 23.5% (7/17) | 0% | 0% (0/12) | 0% |