Census Benchmarking
Analysing the Data -
Methodology 2
In this section we compare the number of police searches for each racial appearance group by ‘benchmarking’ those numbers against the total populations of those groups as identified in the census. This generates a search rate. Police perception and census data are two very different methods to construct racialised groupings. Consequently, this analysis is akin to comparing apples to pears. However, in the absence of directly comparable data, the comparison we construct here provides us with a framework to estimate the existence of systemic disproportionality in the use of police powers.
The starting point is to acknowledge that the concept of race is socially and politically constructed. A person’s racial and ethnic identity can include one or more of their racial and ethnic ancestries. Furthermore, nationality or place of birth, does not necessarily indicate either identity or ancestry. Importantly, how a person may be racially or ethnically perceived (by police officers in Victoria) is a separate concept again.
While the concept of race is socially constructed, the experience of racial/ethnic discrimination is very real. Consequently, while we acknowledge the limitations involved in this analysis, the purpose of this methodology is to create a foundation for estimating the existence of systemic racism in policing. It draws on similar benchmarking methodologies developed by the Equality Commission in the UK, Professor Scot Wortley in Canada and John Lamberth in the US.
Census related limitations
To date, the Australian Census does not collect ethnic identity or ethnic appearance. Instead, it records ‘ancestry’. One of the limitations of the Census is that it allows people to record their ancestry as ‘Australian’. In 2021, 27% of Victorians described themselves as being of ‘Australian’ ancestry. What does this mean? Other than First Nations people, all Australians are immigrants. This 27% of people could be White appearing or appear like any other racialised group. This is a critical issue that the census needs to address to enable effective research into systemic racism in Australia. The present study makes an assumption that people of ‘Australian’ ancestry group are White appearing. We make this assumption based on the ‘normalisation’ of whiteness in Australia that results in White people being more likely to consider themselves ‘Australian’ without qualifying this label than other groups (see Stanaway et. al. 2024)
A second ambiguity is that the census allows people to record up to two ancestries. This means that the number of people of different types of ancestries is 127% greater than the total population in Victoria. To manage this issue we have divided the total number of people with a particular ancestry type by the total responses not the total population to find a percentage in the population figure. Consequently racial appearance populations are estimates only.
Racial appearance population estimates from the 2021 Census
To analyse Victoria’s population, we use ABS’s Tablebuilder tool to extract the ancestries of people resident in Victoria to create an estimated ‘racial appearance’ category from the 2021 Census. Estimates created from the 2021 Census will become increasingly inaccurate as each year passes. To manage this increasing inaccuracy, we will benchmark 2025 data using the 2026 Census. We create population estimates using two assumptions.
Assumption 1: To estimate of the number of people of ‘white’ appearance (Caucasian) we add Australian, New Zealander, and North-West European, Southern and Eastern European, and Jewish categories together. We assume here that the police are likely to ‘racialise’ all European appearing people as ‘white’ (Caucasian) and will, for example, record people of Italian and Greek ancestry as being of white (Caucasian) appearance.
Assumption 2: To estimate the number of people of ‘white’ appearance (Caucasian) we have added Australian, New Zealander, and North-West European, and Jewish categories together. The assumption made here is that the police can distinguish visually between Europeans from Southern and Eastern European (Mediterranean) ancestry from other Europeans. Because Victoria Police have merged Mediterranean with Middle-Eastern, this analysis swamps the policing experience of people who appear Middle-Eastern with people who may be being treated as ‘White’. To remedy this problem we recommend that Victoria Police in future separate Middle-Eastern from Mediterranean.This produces a different set of data that you can see here.
2.1 Are the Victoria Police search rates of different racial appearance groups proportionate to their estimated population?
Because some Aboriginal people may not be perceived at first glance to be Indigenous, in order to establish the total number of searches of Aboriginal and Torres Strait Islander people by police we add the people who police perceive to be Aboriginal to the people who were recorded as being of Indigenous Status. Where people are listed as being of Indigenous status and Aboriginal appearance we count them only once. Indigenous Status is recorded if a person has been arrested and detained by the police and is based on their self-identification. Figure 6 below sets out the search rate for racial appearance groups in Victoria as a proportion of their percent in the overall Victoria population and compares that with search rate of white people, compared with their overall population. The groups included in this analysis are those who collectively experienced at least 200 searches during each year.
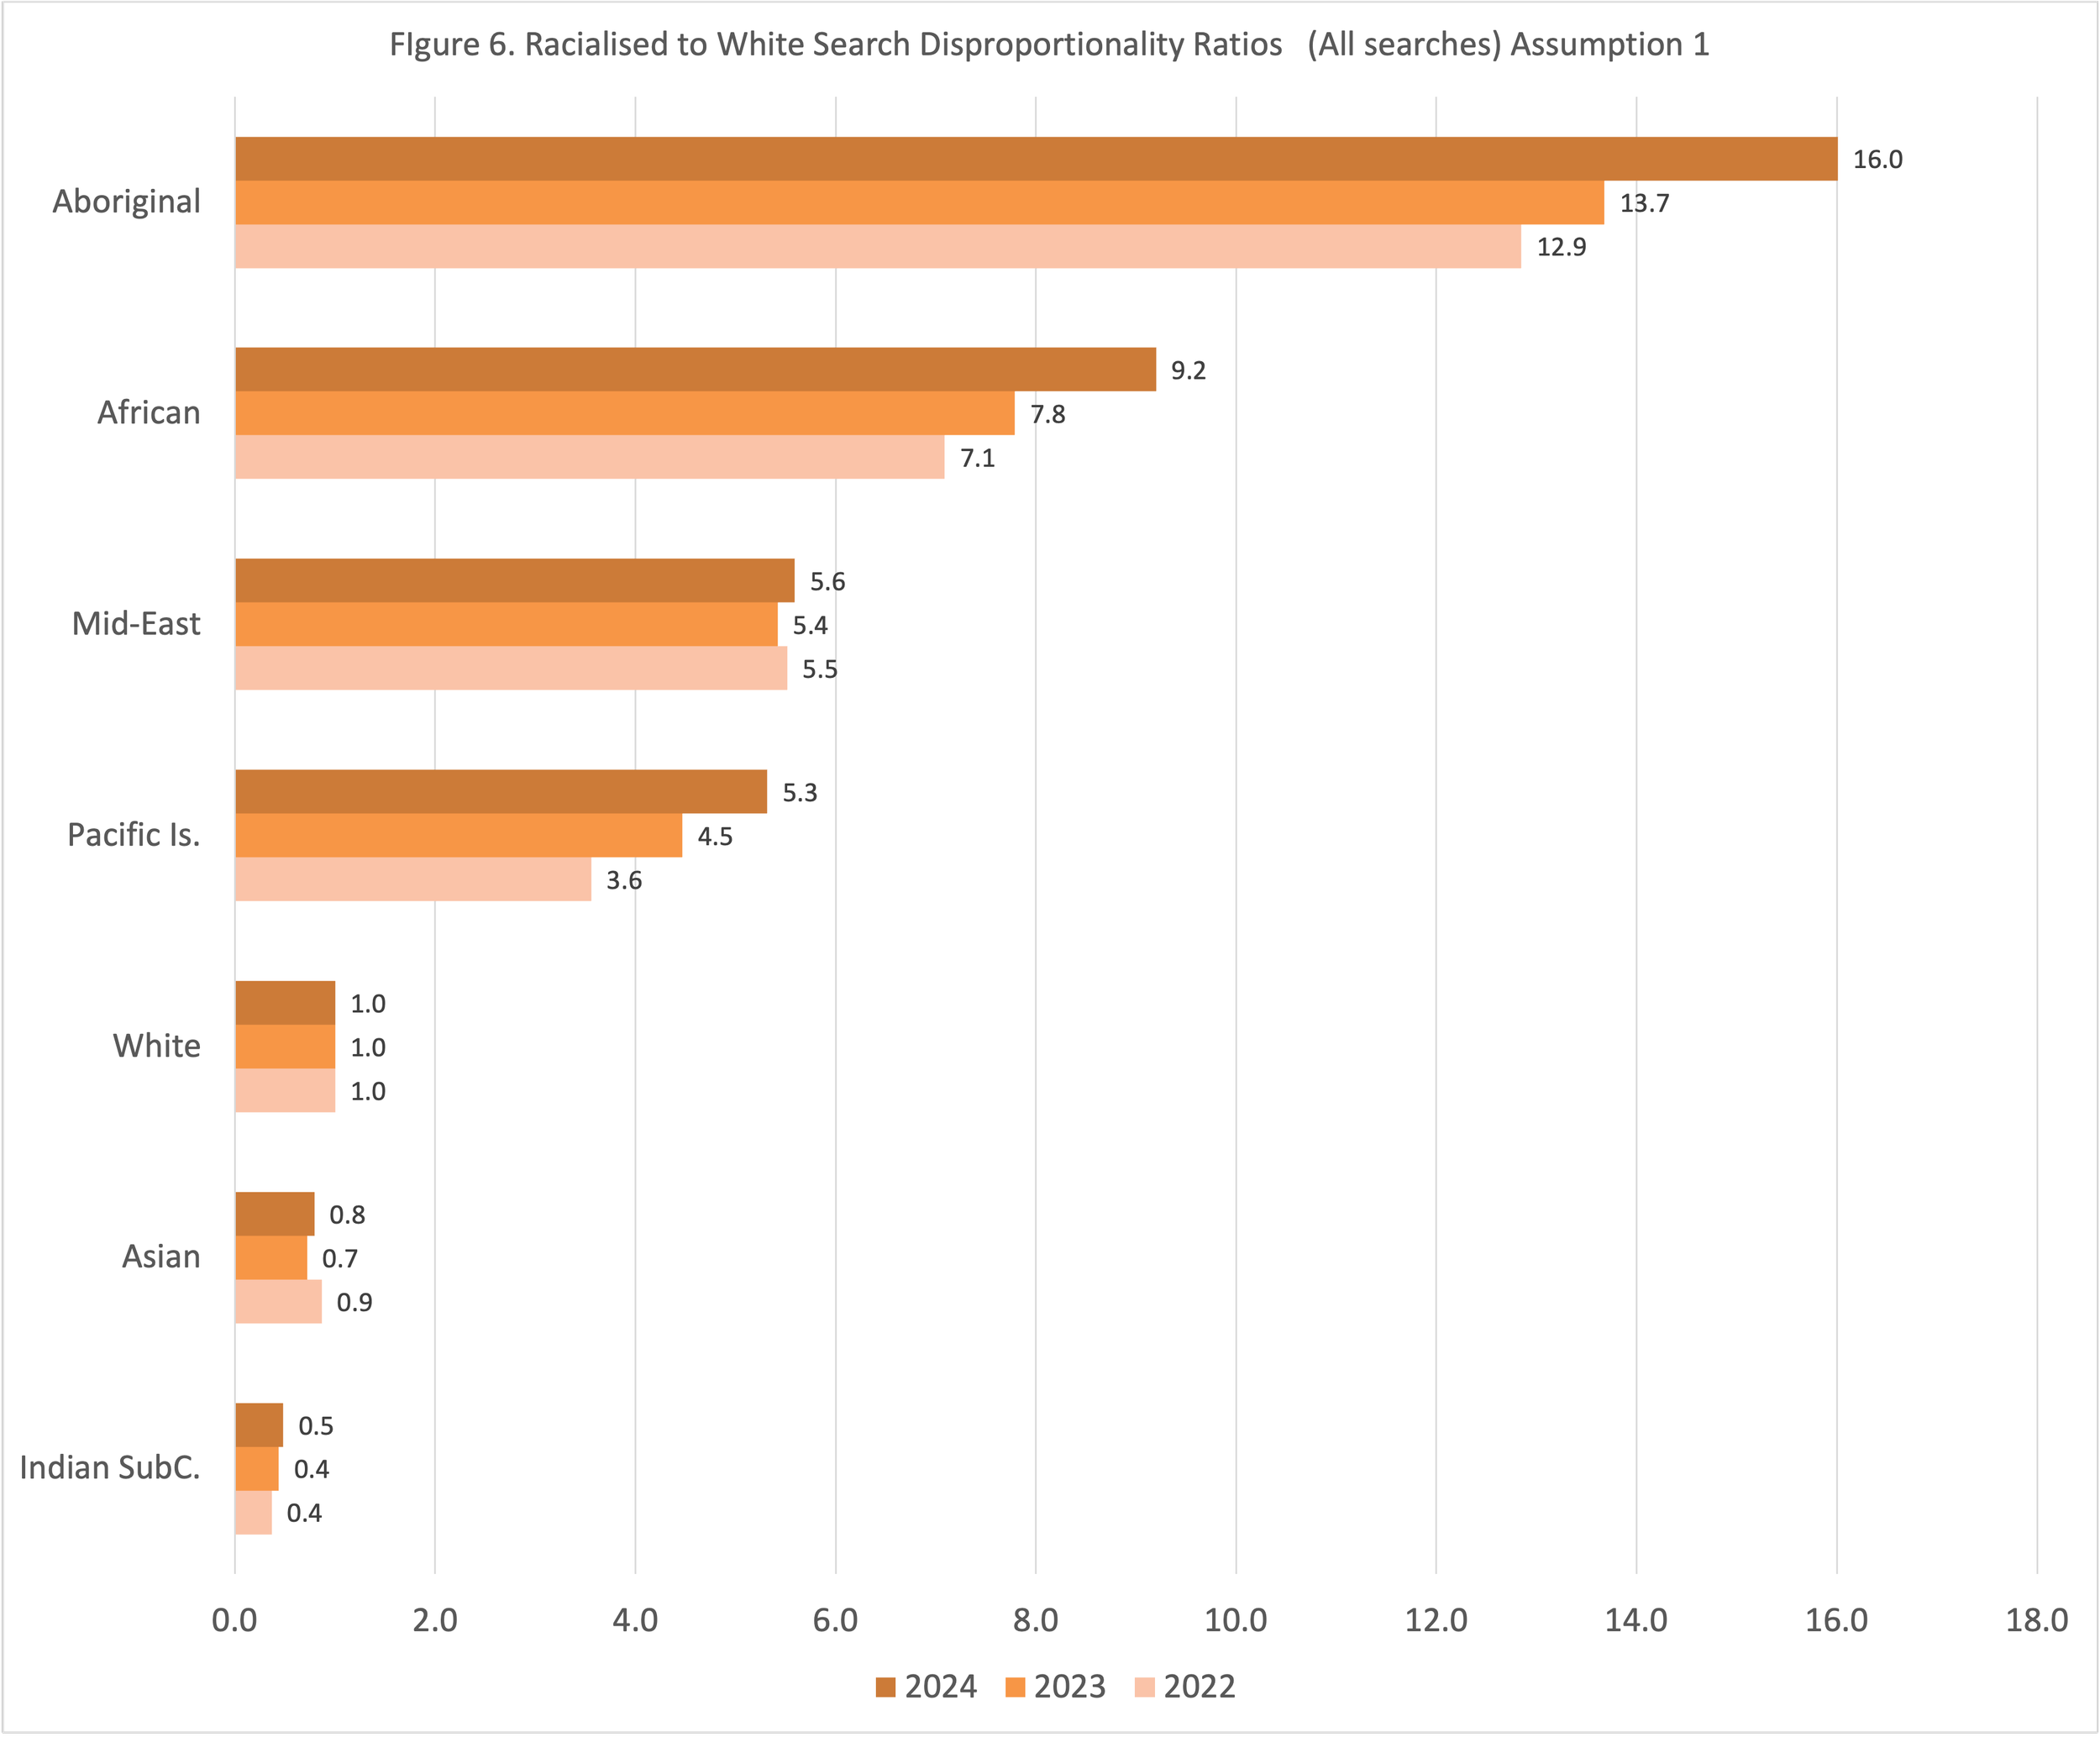
Figure 6 provides preliminary evidence that in 2024 the police subjected people they perceived to be Aboriginal and Torres Strait Islander Victorians to approximately 16 times the rate of searches than people they perceived to be white, relative to estimated population size. People subjected people who police perceive to be African to a rate of 9 times the searches than the rate of people perceived to be white, compared to estimated population size. The rate for people percieved to be Middle-Eastern was almost 6 times the rate of White people compared to estimated population size, and people who are perceived by police to be Pacific Islanders it was 5 times compared with White people.
The data used to calculated these disproportionality ratios is available here.
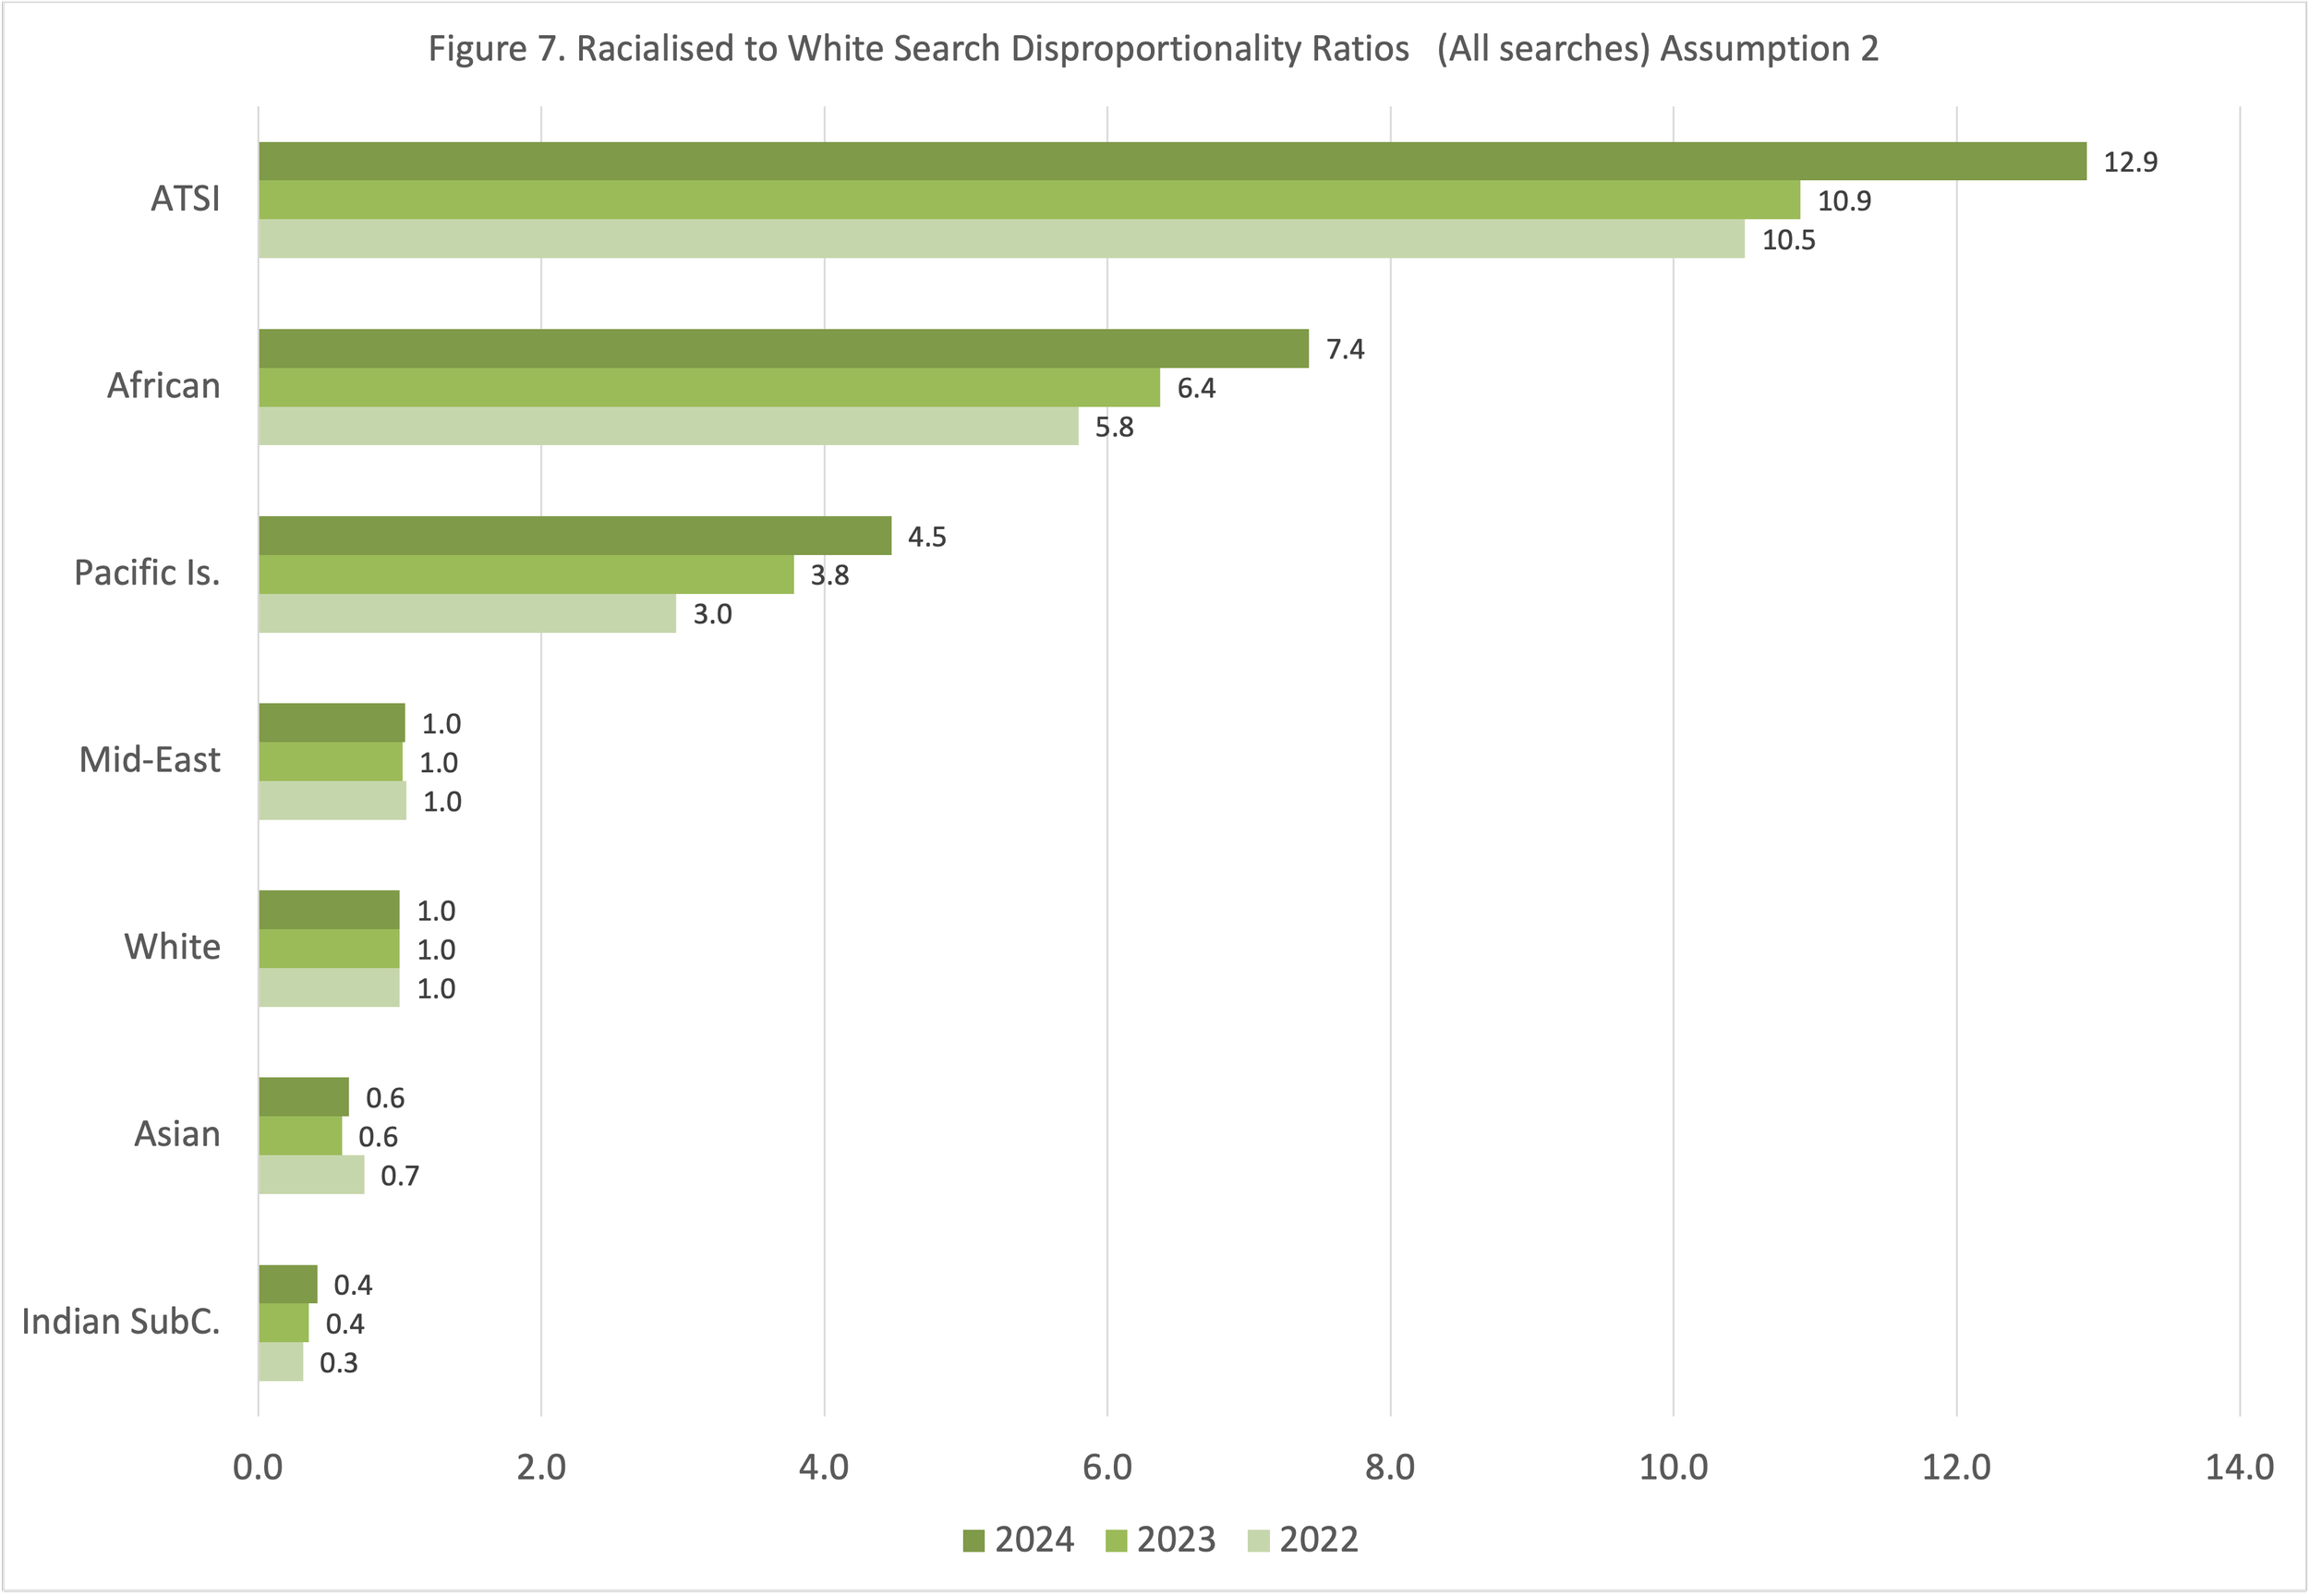
Figure 7 below compares the search rates of different groups with the search rate of people perceived to be White using Assumption 2. In this assumption we assume police can distinguish between people with Mediterranean ancestry and White people.
2.2 How does Victoria compare with NSW?
The ABC obtained search data from NSW police between 2020 to 2024. The data they obtained, when compared to NSW 2021 Census data revealed the following: Aboriginal and Torres Strait Islander people are searched at 5.6 times the rate of White people. People perceived to be African are searched at 4.3 times the rates of White people. Pacific Islanders are searched at 3.0 times the rate of White people. People perceived to be Middle-Eastern are searched at 2.9 times the rate of White people. All other groups are searched at a lower rates to White people. The NSW findings are consistent with the findings for Victoria Police, using Assumption 1 rather than Assumption 2. Unlike NSW, in Victoria, Police combine people they perceive to be ‘Middle Eastern’ with ‘Mediterranean’. In NSW, these groups are separated and people who appear to be Mediterranean are searched at a lower rate than White people. You can see the analysis of the NSW data here. The ABC’s report on the data is here.
Discussion
This data reveals that people police perceive to be Aboriginal, African, Middle Eastern and Pacific Islander are more likely to be subjected to a search without warrant than is expected from their respective proportions in the population. This disproportionality is an indication of systemic racism against these populations. In our view, Assumption 1 (that all people police perceive to be of European origin will be treated as ‘Caucasian’ or ‘White’ by the police) is more likely to be correct. We form this opinion for three reasons. Firstly, since 1901, all Europeans have been treated as White in Australia through the introduction of the White Australia Policy. People considered ‘White’ were entitled to enter Australia if they passed the European language dictation test (Lake and Reynolds, 2008, 147-148). European Australians have for 125 years been granted ‘White’ status by the Australian State despite their highly diverse cultures, languages and experiences of discrimination (eg Greek and Macedonian language speakers, Jewish people, Roma/Travellers). The White Australia policy specifically permitted entry to people speaking Mediterranean languages (such as Greek and Italian) and not to people whose languages originated from Middle-Eastern/Arab/Muslim populations. This means that a greater percentage of people who have Greek and Italian ancestry are now more likely to be second or third generation and have Australian accents and are likely to be assessed as ‘caucasian’ by police than people who are more recent arrivals. Our second reason for preferring assumption 1 is that when police data separated Middle-Eastern from Mediterranean searches in NSW, it is apparent that these two groups are being treated differently. NSW data also clarifies that Mediterranean and White groups are more or less treated similarly by police. Thirdly, assumption 1 is consistent with other data sources that Middle-Eastern/Arab Australians are treated differently by police than Europeans. For example the policing of Muslim and Arab Australians has been consistently concern since September 11 and the passing of laws that have been used disproportionately to surveil Muslim communities. Consequently we report the findings from Assumption 1 in our key findings and we use Assumption 1 for our assessment of use of force.
In 2024, when compared with people perceived to be White people, people perceived to be Aboriginal and Torres Strait Islanders subject to searches at 16 times the rate of White people, people police perceive to be African are searched at 9 times the rate of White people, people the police perceive to be Pacific Islanders are searched at 5 times the rate of White people and police the police perceive to me Middle-Eastern are subject to searches at 6 times the rate of White people, when compared to relative population size.
A census benchmarking analysis of search data from Victoria Police reveals systemic racism toward (that is the disproportionate over-policing of) all non-White groups, except people perceived to be Asian, and Indian.
Search Locations
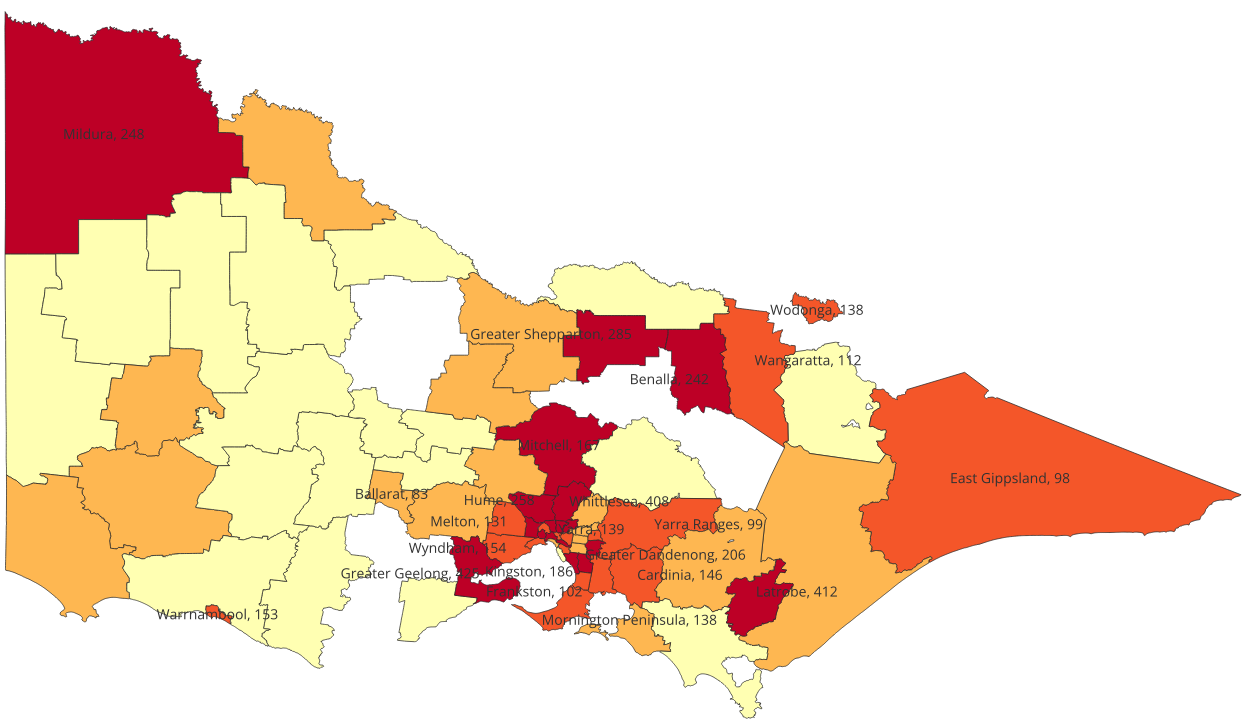
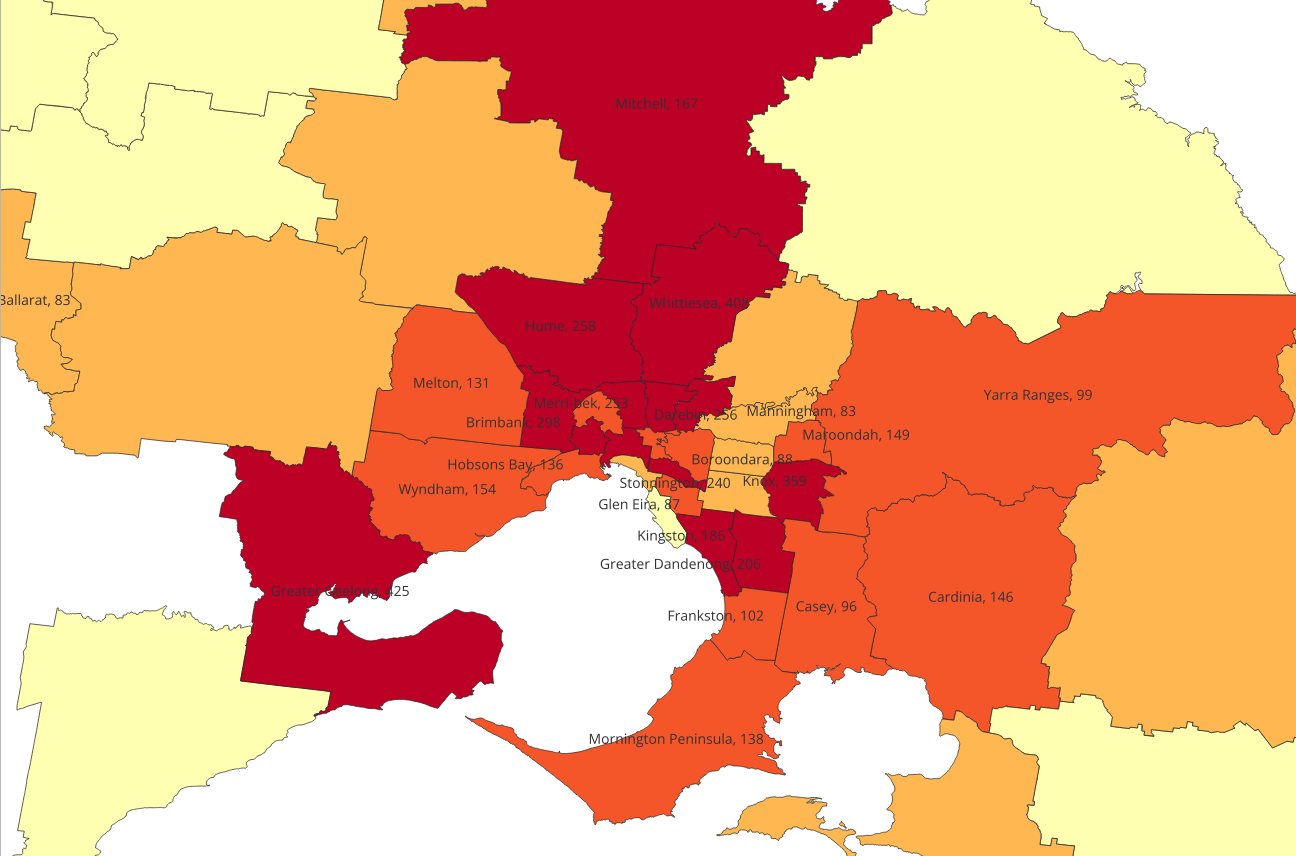
Map 1 shows the location of all searches in Victoria in 2024, where location can be identified from the name of the police operation. Please note this data includes all searches listed on police L19C forms, but does not include Designated Area Searches. In the map, the quartiles density quartiles are red (161-425), orange (83-161), dark yellow (38-83) and light yellow (1-38)